(How to Get Out There and Actually Check the Math)
P(x) = e-m*mx/x!
is the "Poisson probability distribution function" and gives the probability you'll get x occurences of something if the average or mean value of the "population" is m. x! stands for x factorial (e.g. 4! = 4*3*2*1) and e = the famous constant 2.71828+ ("Euler's number")
http://www.anesi.com/poisson.htm
As the above link says, there are many things that exhibit a so-called Poisson distribution. This picture of dandelions is one of them. I did a rough count of all the dandelions and came up with about 400. When printed, the image measured roughly 3 3/4" x 8". This works out to about 3 1/3 dandelions per 1/4" square (details omitted but check my math). I then cut out a 1/4" square "hole" in a piece of paper and randomly placed this "window" on various places of the printed image. I did this 20 times and each time I counted the number of dandelions in the window. (This is a little tough to do because it's hard to see the flowers in some cases and of course you sometimes get 1/2 a flower etc.)
Despite all the above rough estimating, I came up with the following results:
There were / was
1 "window" that contained 0 dandys 1/20 = .05
3 "windows" that contained 1 dandy 3/20 = .15
5 "windows" that contained 2 dandys 5/20 = .25
4 "windows" that contained 3 dandys 4/20 = .20
2 "windows" that contained 4 dandys 2/20 = .10
1 "window" that contained 5 dandys 1/20 = .05
1 "window" that contained 6 dandys 1/20 = .05
1 "window" that contained 7 dandys 1/20 = .05
2 "windows" that contained 8 dandys 2/20 = .10
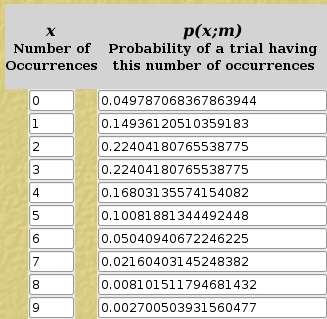
These percentages in the right-most column correspond fairly well with the predicted probabilities when you use the Poisson generator in the above link with a value of 3 for the "expected occurrences per trial" (which is as close to 3 1/3 as we can get).

That fancy formula above is what is used by the Poisson generator to get its numbers. The mx part gets big as x gets big but the x! tends to "damp it out" as x gets big. It climbs from 0 occurrences up to the average and then drops down to nothing pretty quickly. But there *is* a chance you'll see as many as 8 or 9 in a random 1/4".
I find it fascinating that dandelions (and cars arriving at a McDonalds and calls coming into a call center and and ...) all exhibit this kind of "distribution." But then again, I'm tutoring Statistux and there's nothing like teaching to get you interested in such stuff.
