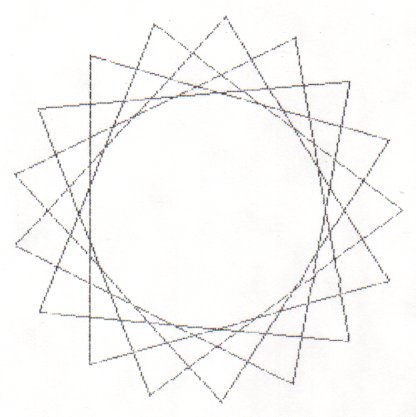
Notes:
1. The original problem came from
http://www.braingle.com/32838.html
2. The following link will show my feedback to my brother who was working on the problem.
http://primepuzzle.com/blog/199.html
3. All the software discussed below is in
http://primepuzzle.com/blog/starps.zip
including a utility that lets you print these "graphs" under DOS even when you don't have the Epson 9PIN impact printer they were designed for!
The following is a somewhat technical "journal" of what I went thru trying to get a "star graph" generator program to work. If you just scroll down to the end you'll see that it now does work. I won't spoil it for you though. You're going to have to plow thru a bunch of code first. Enjoy!
{************************************************************************
 *                                                                      *
 *                          PLOT Test Program                           *
 *                                                                      *
 ************************************************************************}

{**************************************************
 * adapted from TEST.PAS - lrb - 1/17,18,20,21/2008
 **************************************************}

PROGRAM main;
VAR
    x,y: ARRAY [1..17] of REAL;
    a,x1,y1,x2,y2,yf: REAL;
    i,j,n: INTEGER;
    ip,jp: INTEGER;
    step: INTEGER;
    radius: REAL;

{$I GRAF1.PAS}
{$I GRAF2.PAS}

BEGIN
    grinit ('STAR17S4.VEC');

    {        Plot Star           }

    n := 17;
    radius := 0.25;

    FOR i := 1 to n DO BEGIN              { set up corner coord. }
        a := 6.28318 * i / n;
        x[i] := cos(a)*(radius-0.005) + radius;
        y[i] := sin(a)*(radius-0.005) + radius;
    END;

    step := 5;

    Writeln(CON, 'Plotting ',n,'-point skip-',step-1,' star');

{    FOR i := 1 to n DO }
{    BEGIN               }
{        ip := (step*i - (step - 1)) mod n;}
{        if ip = 0 then ip := n;           }
{        jp := (ip + step) mod n;          }
{        if jp = 0 then jp := n;           }
{        segmnt( x[ip],y[ip], x[jp],y[jp] );}
{    END;                                   }

        segmnt( x[01],y[01], x[06],y[06] );

        vector( x[11],y[11] );
        vector( x[16],y[16] );
        vector( x[04],y[04] );
        vector( x[09],y[09] );
        vector( x[14],y[14] );
        segmnt( x[14],y[14], x[02],y[02] );

{        vector( x[07],y[07] ); }
        segmnt( x[07],y[07], x[12],y[12] );
{        vector( x[17],y[17] ); }

        segmnt( x[17],y[17], x[05],y[05] );
        vector( x[10],y[10] );
        vector( x[15],y[15] );
        vector( x[03],y[03] );
        vector( x[08],y[08] );
        vector( x[13],y[13] );
        vector( x[01],y[01] );

    gprint;                                { advance to new frame }
    color(0);
    erase;
    color(127);

{    writecmd('T',1); }                      {use Text cmd to advance page}
{    FOR I := 1 TO 18 DO writecmd( Chr(10),1 ); }
{    writecmd( Chr(0),1 ); }

    Writeln(CON, 'Finished Plotting');
    grfini;
END.
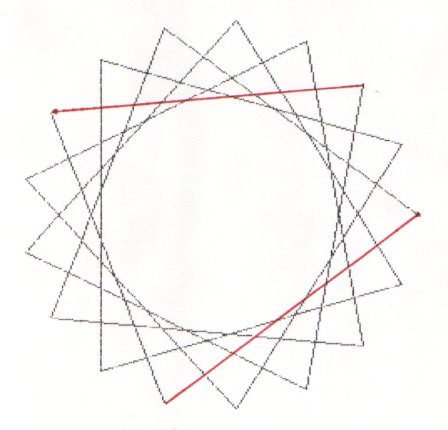
The image up top is the best I can do as of 1/21/2008. The program that
generated it is listed below it. Note the two red lines in the image.
These were hand drawn in after the star graph was "plotted" by the
printer. I have been unable to generate a complete graph with a computer
program. This amazes me because I can't figure out why I can't just add
two more lines of code (to generate the missing lines). The printer
hangs when I do this. I have tried a variety of methods to solve this
problem but, so far, without success.
1. The commented out FOR loop looks solid to me but when I use it, the printer hangs. Notice the use of the modulus operator. 25 mod 17 equals 8. It's the remainder after dividing 25 by 17. This modulus approach greatly simplifies our earlier approach, allowing us to reduce the number of FOR loops to 1.
2. I find this hard to believe, but it appears that the order you plot things in is important. I've been successful printing the first 7 lines, the last seven lines and the middle three lines, on their own, but when I try to print, say, the first 8 lines or the last eight lines etc., the printer hangs.
3. As I was fooling around with printing subsets of the required lines to see if I could figure out what might be causing my printer hang problems, I learned about the vector function which the author has made available. It is documented in one of his DOC files. It's like the segmnt function in that it draws lines but it draws a line starting at the end point of the last line that was drawn. Thus, it only needs the coordinates of the end of the line to be drawn. Notice how I needed to use a few segmnt statements to get the thing started and to skip the two lines that ended up being hand drawn in red. You don't really need to use this vector function but I was just trying to use different tools that were provided just to see if I could find a workaround to the problem.
Here's what I come up with on your recent efforts.
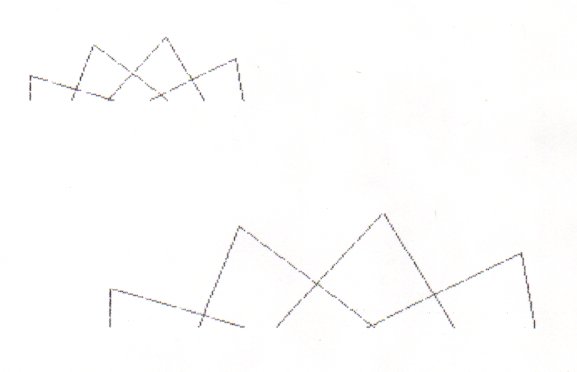
The code below produced the image above. Well, more precisely, the code below produced the larger of the two images above. The smaller of the two images above was created by a similar program that I wrote. Both my program and yours (as modified by me) don't work (but as far as I'm concerned, should). They both hang my printer as you can easily see from the images, which are superb as far as they go but obviously this is not far enuf ... I like to call them Bart images as they sure look like Bart's head.
Here's your code, as modified by me.
{************************************************************************
 *                                                                      *
 *                          PLOT Test Program                           *
 *                                                                      *
 ************************************************************************}

{**************************************************
 * adapted from TEST.PAS - ceb - 1/20/2008
 * tweaked - lrb - 1/22/2008
 **************************************************}

PROGRAM main;
VAR
    x,y: ARRAY [1..17] of REAL;
    a,x1,y1,x2,y2,yf: REAL;
    i,j,n: INTEGER;
    ip: INTEGER;
    step: INTEGER;
    jp: INTEGER; {lrb}


{$I GRAF1.PAS}
{$I GRAF2.PAS}

BEGIN
    grinit ('STAR17S4.VEC');

    {        Plot Star           }
    n := 17;

    FOR i := 1 to n DO BEGIN              { set up corner coord. }
        a := 6.28318 * i / n;
        x[i] := cos(a)*0.49 + 0.5;
        y[i] := sin(a)*0.49 + 0.5;
    END;

    step := 5;

    Writeln(CON, 'Plotting ',n,'-point skip-',step-1,' star');

    FOR i := 1 to 5 DO
    BEGIN
        ip := step*i - 4;
        if ip > 17 then ip := ip - 17; {lrb}
        jp := ip + step; if jp > 17 then jp := jp - 17; {lrb}
        {segmnt( x[ip],y[ip], x[ip+step],y[ip+step] );} {lrb}
        segmnt( x[ip],y[ip], x[jp],y[jp] ); {lrb}
    END;

    FOR i := 1 to 4 DO
    BEGIN
        ip := step*i - 3;
        if ip > 17 then ip := ip - 17; {lrb}
        jp := ip + step; if jp > 17 then jp := jp - 17; {lrb}
        {segmnt( x[ip],y[ip], x[ip+step],y[ip+step] );} {lrb}
        segmnt( x[ip],y[ip], x[jp],y[jp] ); {lrb}
    END;

    FOR i := 1 to 4 DO
    BEGIN
        ip := step*i - 2;
        if ip > 17 then ip := ip - 17; {lrb}
        jp := ip + step; if jp > 17 then jp := jp - 17; {lrb}
        {segmnt( x[ip],y[ip], x[ip+step],y[ip+step] );} {lrb}
        segmnt( x[ip],y[ip], x[jp],y[jp] ); {lrb}

    END;

    {FOR i := 1 to 4 DO } {lrb}
    FOR i := 2 to 3 DO {lrb}
    BEGIN
        ip := step*i - 1;
        if ip > 17 then ip := ip - 17; {lrb}
        jp := ip + step; if jp > 17 then jp := jp - 17; {lrb}
        {segmnt( x[ip],y[ip], x[ip+step],y[ip+step] );} {lrb}
        segmnt( x[ip],y[ip], x[jp],y[jp] ); {lrb}

    END;

   {FOR i := 1 to 4 DO } {lrb}
    FOR i := 1 to 3 DO
    BEGIN
        ip := step*i - 0;
        if ip > 17 then ip := ip - 17; {lrb}
        jp := ip + step; if jp > 17 then jp := jp - 17; {lrb}
        {segmnt( x[ip],y[ip], x[ip+step],y[ip+step] );} {lrb}
        segmnt( x[ip],y[ip], x[jp],y[jp] ); {lrb}
    END;

{    segmnt( x[n-4],y[n-4], x[1],y[1] ); } {lrb}
{    segmnt( x[n-3],y[n-3], x[2],y[2] ); } {lrb}
{    segmnt( x[n-2],y[n-2], x[3],y[3] ); } {lrb}
{    segmnt( x[n-1],y[n-1], x[4],y[4] ); } {lrb}
{    segmnt( x[n],y[n], x[5],y[5] ); } {lrb}

    gprint;                                { advance to new frame }
    color(0);
    erase;
    color(127);

{    writecmd('T',1); }                       {use Text cmd to advance page}
{    FOR I := 1 TO 18 DO writecmd( Chr(10),1 ); }
{    writecmd( Chr(0),1 ); }

    Writeln(CON, 'Finished Plotting');
    grfini;
END.
The basic alterations I made to your code involve making sure the subscripts you feed to the x[ ] and y[ ] arrays are legal. The subscripts need to be in the [1..17] range. If you look carefully at your original code, as you let i range between 1 and 5 or 1 and 4, the computed value of the subscript ip goes out of range. I made all sorts of changes, looking at your code and referring back to the required endpoints of the lines we need to draw which are dictated by the "sequence" that applies here, namely
1,6,11,16,4,9,14,2,7,12,17,5,10,15,3,8,13,1
There are a variety of ways to fix your code. I just fiddled around, changing the start and stop points of the i variable used in the FOR loops sometimes and eventually seeing that I could totally eliminate all of the "tie-em-together" segmnt statements at the end.
This code is of course pretty hard to follow, but if you walk it thru you should see that it draws all the required lines. When code gets so patchy like this you have to say "There's GOT to be a simpler way to do this!" That's where my single FOR loop which uses the mod operator comes in.
Of course I hoped that by some miracle this patchy code, when run, would actually work, but, alas, my printer hung, right on schedule. The patchy program compiles clean (no longer getting that "Run-Time Error 92" which the Turbo manual tells me means "Out of range integer" etc. etc.) but it doesn't work.
I wonder if Tom Speer has any ideas ...
How should I put this? I Google on Tom Speer Dayton, OH in the 1 in 1,344,227 chance I'll get a hit. Then it occurs to me, maybe PLOT33.COM is busted. So I consider reassembling the .ASM source code. Then it occurs to me, "Hmmm, how 'bout ZPLOT.COM?" (a compatible program). So I run ZPLOT on my .VEC file and called the output TOMSPEER.PLT, just to keep it different than STAR17S4.PLT. Then I compare (with COMP.COM) the two files, figuring there's a snowball's chance in Hell they'll be different. They're different. So I issue the command
PIP LST:=TOMSPEER.PLT
I watch / listen as the Epson goes tick tick tick tick tick, patiently waiting and expecting it to go silent at about the 23rd tick.
21, 22, 23, 24, 25, 26, 27, 28, 29, 31, 32, ...
Holy Cannoli!
Moral: Sometimes it's your code. Sometimes it's the data. And sometimes it's the other program it NEVER occurred to you was flawed.
Now, of course, it should be a piece of cake to write that general purpose program I think I mentioned somewhere that takes two command tail arguments and generates ANY one of the (p-3)/2 p-point stars, where p is prime. And it'll be a tiny program.
For example :
STARPS 19 5 will give us the "skip 5" 19-point star.
Update as of 1/22/2008 5:18 PM
Turns out, I was wrong! There was nothing wrong with PLOT33 after all! It was my failure to remember the reminder in the documentation that PIP needs to use the [O] option when you are dealing with "object" (ie. binary) files! It was this that was hanging the printer all along! So it was your typical case of user error and nothing more! Not only that but the original single FOR loop that used the modulus operator was just as solid as I figured it was! No need for vector.
Here's the new code (which takes 2 command tail arguments). I called this one STARPSA.PAS (for Alternate). There is a STARPS.PAS as well and it's the same as STARPSA.PAS except it uses the vector method. Both programs work.
{

STARPSA.PAS - lrb - 1/22/2008

Operating system: CP/M or Z-System

Compiler: Turbo Pascal 2.0

This program generates ZPLOT-compatible .VEC files for any "star graph"
which has a prime number of points between 7 and 101, inclusive.

After running this program, use ZPLOT to generate a .PLT file from
the .VEC file.

An Epson-compatible dot matrix printer with graphics capability is
needed to print the .PLT files.

Usage: STARPSA p s

where p is the number of points on the star and s is a "skip" number.
Lines are drawn from a point to another point on the star, skipping s
points each time.

Ref: http://primepuzzle.com/blog/starps.html

}

PROGRAM main;

LABEL
    foo;
TYPE
    PRIMES = set of 7..101;
    Str80 = string[80];
VAR
    x,y: ARRAY [1..101] of REAL;
    a,x1,y1,x2,y2,yf: REAL;
    i,j,n: INTEGER;
    ip,jp: INTEGER;
    step,skip: INTEGER;
    radius: REAL;
    points,skips: string[3];
    code: INTEGER;
    prime: PRIMES;
    work: INTEGER;
    good: BOOLEAN;

{$I GRAF1.PAS}
{$I GRAF2.PAS}
{$I PARAMSTB.INC}

BEGIN

    Writeln('');
    Writeln('STARPSA - 1/22/2008 - lrb');
    prime := [7,11,13,17,19,23,29,31,37,41,43,47,53,59,61,67,71,73,79,83,89,97,101];
    good := True;
    work := length(ParamStr(1));
    work := work*length(ParamStr(2));
    If work <> 0 THEN BEGIN
      points := ParamStr(1);
      Val(points,n,code);
      skips := ParamStr(2);
      Val(skips,skip,code);
      step := skip+1;
      IF NOT (n in prime) THEN good := False;
      IF (skip > (n-3)/2) or (skip < 1) THEN good := False;
    END
    ELSE good := False;
    IF NOT good THEN BEGIN
      Writeln('Usage : STARPSA points skip');
      Writeln('where points is a prime number in 7..101');
      Writeln('and skip is less than or equal to (points-3)/2');
      GOTO foo;
    END;

    grinit ('ST'+points+'S'+skips+'.VEC');
    radius := 0.25;

    FOR i := 1 to n DO BEGIN
      a := 6.28318 * i / n;
      x[i] := cos(a)*radius + radius;
      y[i] := sin(a)*radius + radius;
    END;

    Writeln(CON, 'Plotting ',n,'-point skip-',step-1,' star');

    FOR i := 1 to n DO
    BEGIN
        ip := (step*i - (step - 1)) mod n;
        if ip = 0 then ip := n;
        jp := (ip + step) mod n;
        if jp = 0 then jp := n;
        Writeln('drawing ',ip,' ',jp);
        segmnt( x[ip],y[ip], x[jp],y[jp] );
    END;

    Writeln(CON,'Printing title');
    gstrng(0.425,0.95,'ST'+points+'S'+skips);

    gprint;
    color(0);
    erase;
    color(127);

    Writeln(CON, '');
    Writeln(CON, 'Finished plotting.');
    Writeln(CON,'ST'+points+'S'+skips+'.VEC ready for ZPLOT!');

    grfini;
foo:
END.
Check out the images!
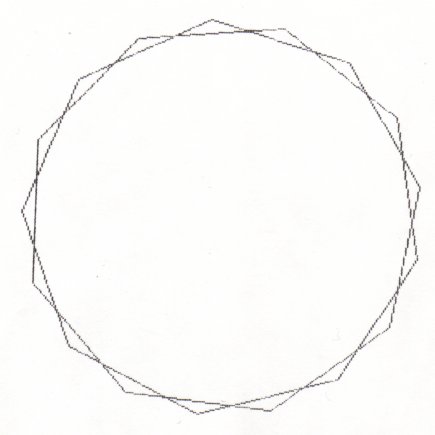
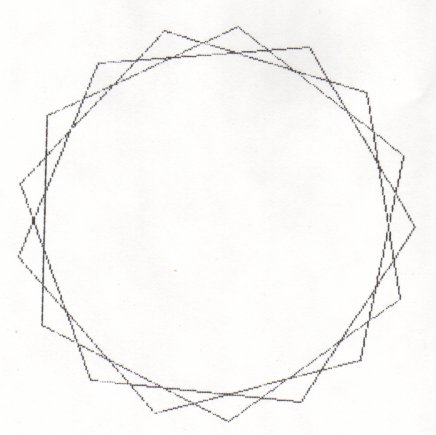
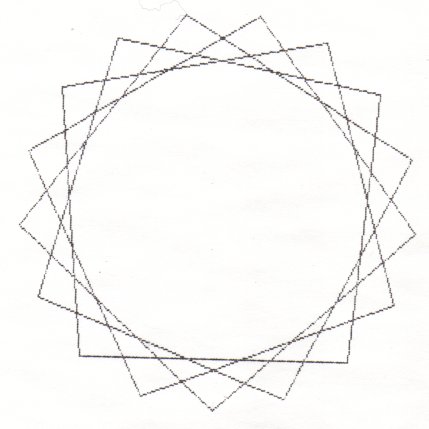
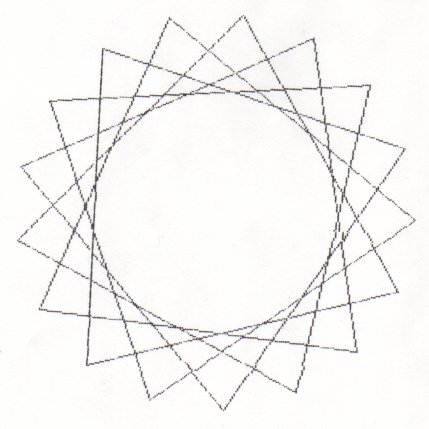
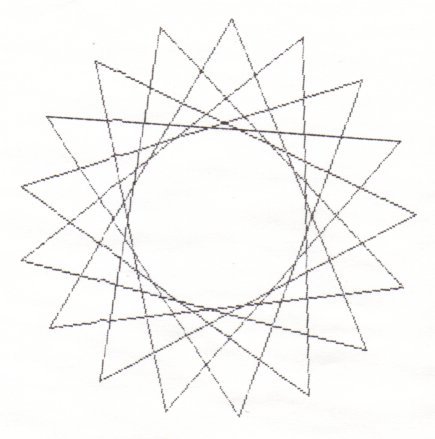
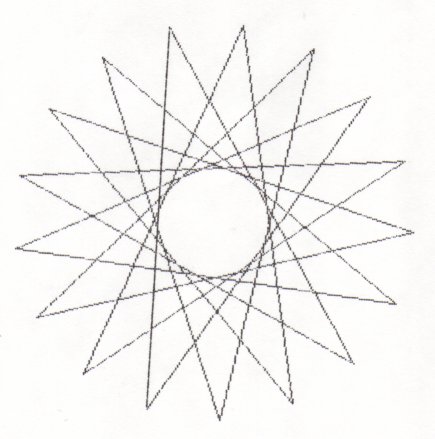
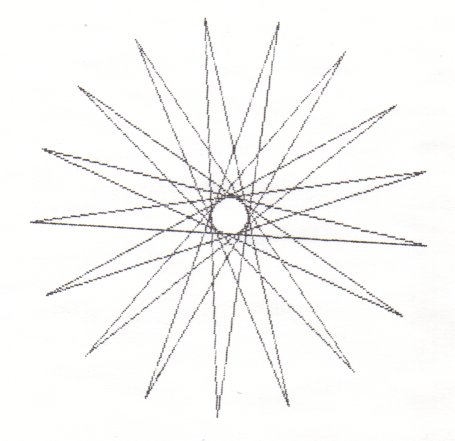
Here're a few more.
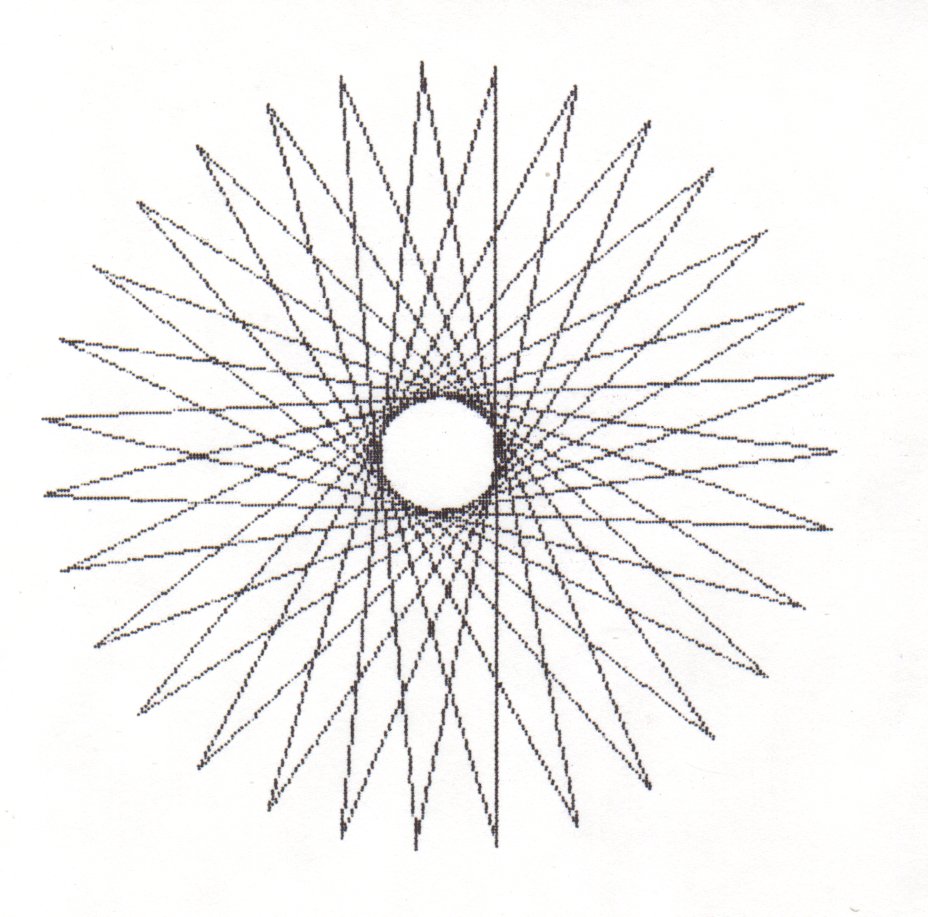
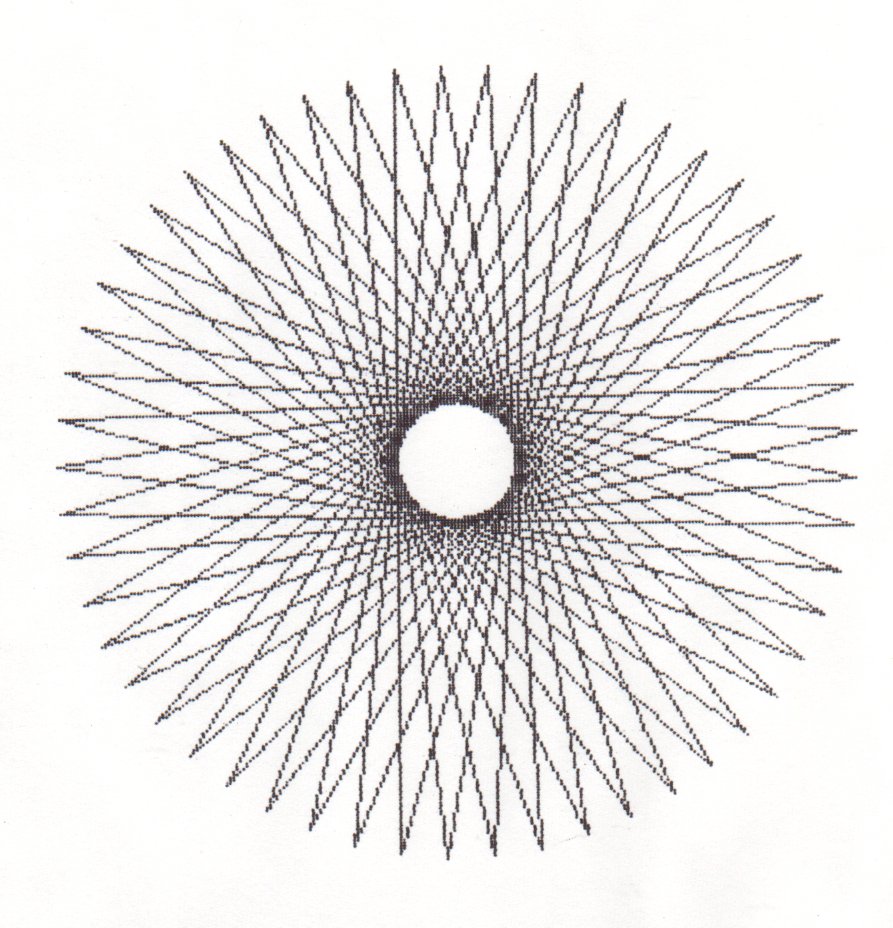
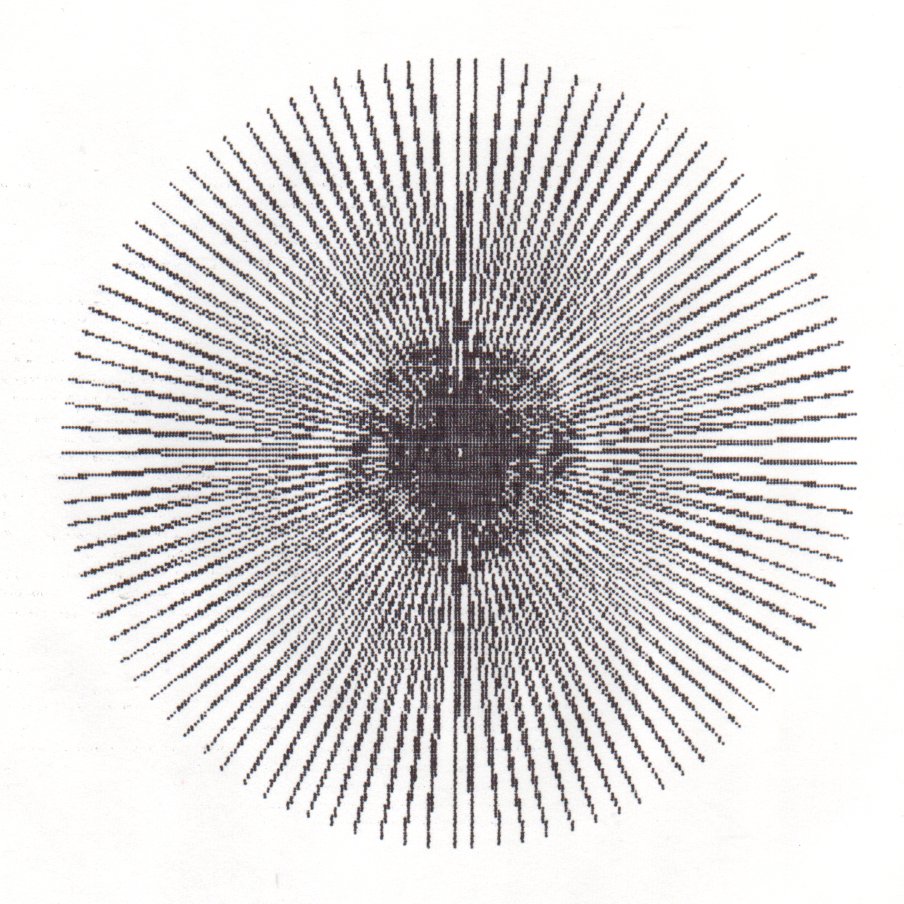
The points visited, in order, for the above 101-point "skip" 49 star are :
0 50 100 49 99 48 98 47 97 46 96 45 95 44 94 43 93 42 92 41 91 40 90 39 89 38 88 37 87 36 86 35 85 34 84 33 83 32 82 31 81 30 80 29 79 28 78 27 77 26 76 25 75 24 74 23 73 22 72 21 71 20 70 19 69 18 68 17 67 16 66 15 65 14 64 13 63 12 62 11 61 10 60 9 59 8 58 7 57 6 56 5 55 4 54 3 53 2 52 1 51 0 *
Can you spot the hole in the middle of the last one (101 points, skip 49)? Talk about black holes. Or rather white holes. Looks like the Big Bang to me.
BTW, I just used the command
5:54 A6:EBC>>PIP LST:=STAR17S4.PLT[O]
after compiling Pacific Paul's (patched by me, see above discussion) program, running it and PLOT33ing it. Works like a charm.
Update as of 1/24/2008
I've improved STARPS.PAS in several ways and would like to summarize what's new. STARPS now takes an optional third command tail parameter which may be used to control the size of the star. It may be between 0 and .5. If you use .5 (or don't supply a third parameter) you'll get a star with radius .5*8" (which means the diameter will be 8"). If you supply a third parameter which is less than or equal to .45, you'll get a star with radius .45*8" (or less) and in addition, a title will be added to the graph. For example
STARPS 37 9 .45
will have a title which reads ST37S9 radius=0.45
I plan on cutting what I call a "Stargram" puzzle based on these images. Here's my first design.
